
Blog » Fall & Winter Nitrogen Movement
Fall & Winter Nitrogen Movement
2016-2017 fall/winter has been one for the record books...with all that moisture we received do you know where your leachable nutrients are located in the soil profile?
Fall of 2016 for sure made its coffee table rounds as a wet one. The weather delayed and extended planting season well into November for some. But just how wet was it and what other consequences might the timing of the rain had?
 To answer the first question, I turned to NOAA to pull divisional precipitation normality maps broken out into 30 day increments for each sub regional division. The entire PNW was ‘much above average’ in precipitation amount for the month of October, with a majority of Washington and the northern Idaho panhandle set a 100 year record for precipitation totals.
 Drilling down to a specific weather station, the graph shows both precipitation (bars) and average daily max temps (lines). Pullman’s weather station is reporting a total of 15.25”of precipitation September 2016 through February 2017, which is 2.9” or 24% ahead of the 50 year average for the same time frame. October specifically was the wettest month in Pullman's history by 2.4” beating out 1997.
Looking at weather data can help explain trends we are seeing in the field as well as clue us into potential issues to come for our crops. Reviewing Pullman's weather data, the other interesting trend that jumped off the page to me was the temperature line in November. November in Pullman will generally average 44 degrees for a daily high temp. November 2016 was unseasonable warm in comparison with an average daily high of 55 degrees. This was the warmest November on record by 5 degrees.
 Did that warming weather trend after a month of record rainfall hold for other parts of the PNW or was it localized? I turned back to NOAA to pull divisional normality maps but this time pulled average daily max temperature data. For most of the ag producing regions of Washington and northern Idaho, a record was set for warmest November in the past 100 years, sustaining temps over 50 degrees!
Seeing those record setting weather trends going into winter, my head goes to how does this information effect the nutrient plan we have in the ground and how it can change spring top dressing game plans?
Quick dive into the nitrogen cycle, remember our nitrogen fertilizer sources can be divided into 2 main categories: ammonium fertilizer with N in the NH4 form and Urea constraining fertilizers (UAN 32) with N in the NO3 form. Nitrogen that stays in the ammonium (NH4) form is immobile and can not be lost. However NH4 naturally converts to nitrate (NO3) through nitrification. The 2 main ways we lose fall applied nitrogen is through nitrification and leaching with denitrification generally playing a smaller role.
Nitrification is greatly influenced by soil temp and available moisture. The process is faster in warmer soils and slow to non-existent in colder soils. This is why our general recommendation is to wait until the soils have a SUSTAINED temperature of 50 degrees or less before applying NH4 forms. That being said, with the record warmer and wetter conditions, we were exposed to nitrifying and leaching conditions much later into the season this year than any other season.
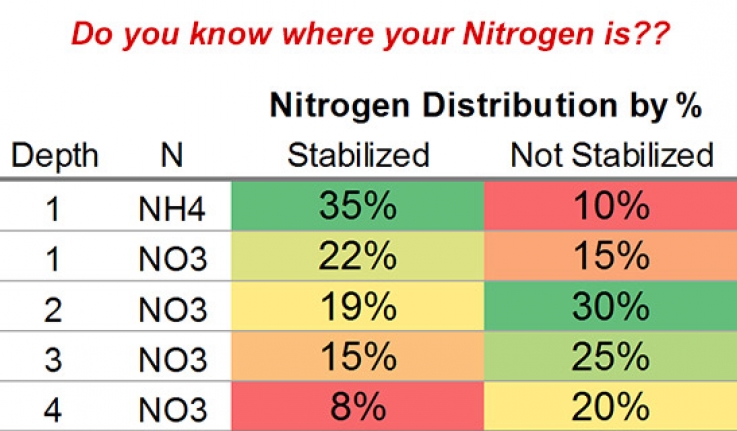
So, that leads to the question of where exactly is our N going into spring? What we did was go sample 8 fields in the Blue Mountain and South Palouse regions the first 2 weeks of February. We pulled samples from a field that had a portion of the nitrogen application stabilized with N-Serve, and a portion not stabilized. We then calculated the percent distribution of nitrogen across a 4 foot profile. We found the not stabilized acre had 50-55% percent of the N in the 2nd and 3rd foot. In the stabilized acre, that same 50-55% was still in the top foot. We can also apply this movement data to ANY of our leachable and mobile nutrients, Sulfur, Chloride, Boron.
 This spring we will likely see plants struggling to compensate for very cool temperatures, soils that have little mineralization happening and that have undergone fall conditions that have led to significant amounts of leaching potential.
Contact your local McGregor Account Manager today to get your mobile nutrient game plan ready for top dressing season.
Comments
Cat Salois 17/03/2017 9:37am (7 years ago)
Several questions on when soil sanples were taken...First 2 week of Febuary 2017. BEFORE all the spring rains started.
No one has commented on this page yet.
Post your comment